Depends how you look at it
On June 24-26, the Phillies struggled in Houston, scoring one lone run in the entire three-game series. They then exploded for 13 runs to start the series in Atlanta, before scoring just one and two runs in their last two games there. Whenever the Phillies go through big swings in scoring like that, there are invariably comments about how inconsistent the Phillies offense is. The worry underlying this sentiment is that the offense is not as good as the top-line stats might indicate — that it’s good for the occasional big game, but then too often struggles to get much going at the plate.
If we look beyond the anecdotal stretches and review the entire first half, just how inconsistent are they? And how do they compare to the rest of the league in that regard?
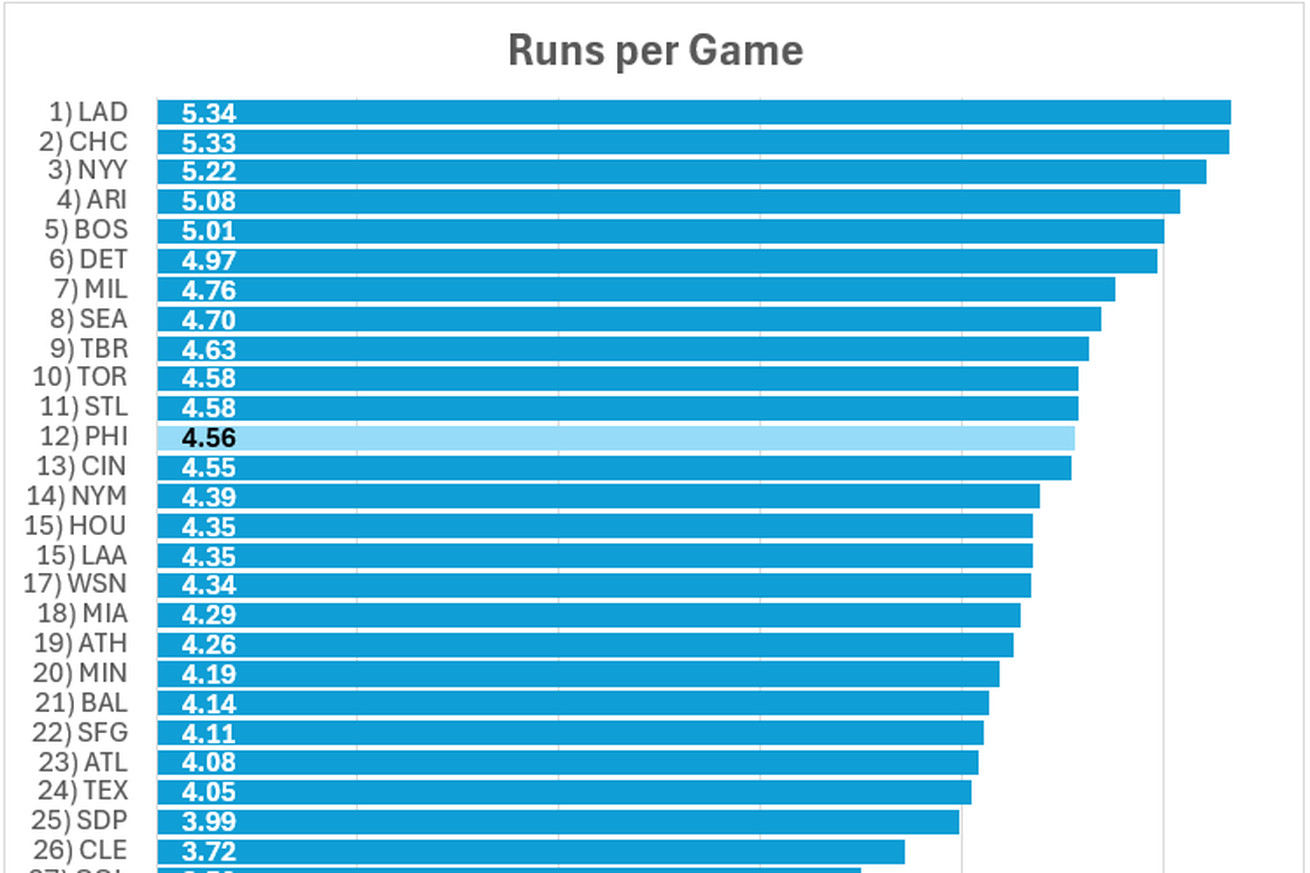
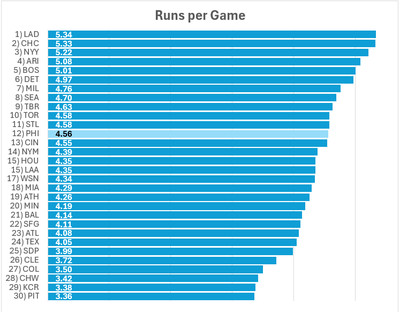
The Phillies in the first half were 12th in MLB in average runs scored per game, at 4.56. They were part of a scrum bunched together from 10th-13th:
This is the weakest the offense has been since they finally broke through to the postseason in 2022:
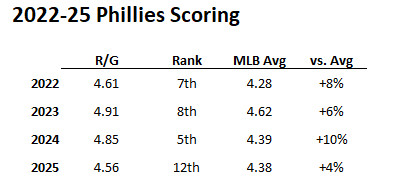
Basically this tells us they’ve been slightly above average so far — but is even this modest assessment inflated by a few big games?
We’ll look at four different ways of measuring consistency:
1. Standard deviation, measuring how much runs scored in individual games vary from a team’s average.
2. Average change sequentially from one game to the next. For example, if they had games with 7, 1, and 4: changes of 6 and 3, for a total of 9, so the average change is 9/2 or 4.5.
3. Change in average runs per game from one week to the next. For example, 4.5 in week 1, 6.0 in week 2, 3.0 in week 3: changes of 1.5 and 3.0 for a total of 4.5, so the average change is 4.5/2 or 2.25.
4. Runs distribution: how often they score 0, 1, 2, 3, etc. in a game.
Standard Deviation
The Phillies’ calculated standard deviation is 3.12. Because bigger numbers tend to have bigger variations, the standard deviation is typically adjusted for that, or normalized, by dividing it by the average. The result is the standard deviation as a percentage of the average, which is also called the coefficient of variation.
For the Phillies that’s 3.12/4.56, or 68% — that’s the 7th lowest coefficient of variation in MLB, i.e. their run scoring has been the 7th least volatile, or most consistent.
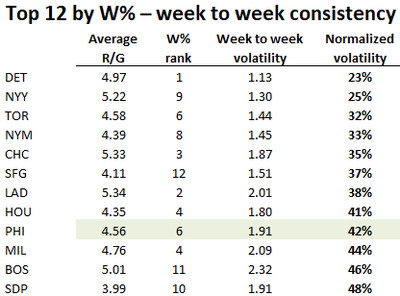
While that’s encouraging, it would also be good to know how it compares to teams that the Phillies are likely to face in the postseason — meaning are the teams they’re likely to face less prone to inconsistency? For this comparison we’ll use the 12 teams with the highest winning percentage, regardless of what league they’re in:
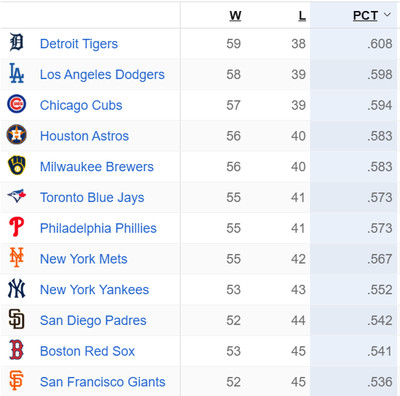
Among just these top 12 teams, the Phillies’ 68% is the 3rd lowest coefficient of variation.
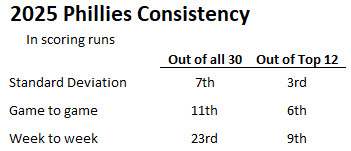
Standard Deviation
Among all 30 teams: 7th most consistent
Among top 12 teams: 3rd most consistent
Game to Game Variation
The Phillies’ average change in runs scored (up or down) from one game to the next is 3.46. When normalized by the average runs per game, it’s 74% — this is 11th lowest in MLB.
Among just the top 12 teams, the 74% is the 6th lowest volatility, or around the middle.
Game to Game
Among all 30 teams: 11th most consistent
Among top 12 teams: 6th most consistent
Week to Week Variation
Instead of looking for game-to-game spikes, we can also look for longer term peaks and troughs.
A week is an arbitrary length of time, and typically includes 6 or 7 games. We could also look at sets of 5 games, or 10, or really any number, but a week is as good as any and is easy to explain and understand.
For this exercise we’ll skip the Opening week which only had three games, and start with the season’s first Monday, March 31st:
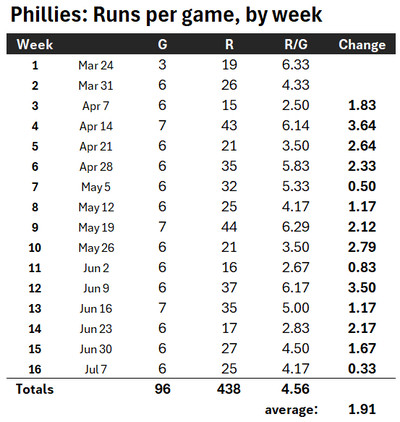
The Phillies’ average change in runs per game from one week to the next is 1.91. This has been among the highest in MLB so far this year. After normalizing it it’s the 23rd lowest, or most consistent (i.e. 8th most inconsistent).
It’s also on the volatile side among the top 12 teams, ranking as only the 9th most consistent:
Week to Week
Among all 30 teams: 23rd most consistent
Among top 12 teams: 9th most consistent
Runs Distribution
We can also analyze how their runs are distributed, to investigate whether they’re especially prone to the kind of up and down scoring we discussed in the first paragraph. For example, do they have a high number of big games, but also a lot of games where they score very little?
For this one we don’t have a ranking per se, but we can compare patterns of scoring.
It seems like the Phillies get shut down a surprising number of times, and in fact they’ve scored 0, 1, or 2 runs 29 times this year, or 30% of their games.
That sounds like a lot, so how does it compare to the other likely playoff teams?
The 12 top teams have scored 0, 1, or 2 in almost exactly the same proportion, 29%:
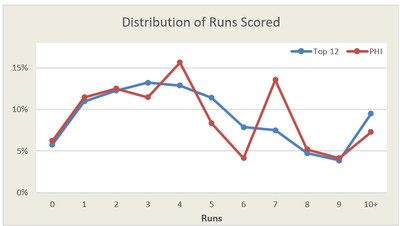
The difference between the Phillies’ distribution of runs, and that of the average Top-12 team, can be summarized like this: the Phillies have…
1 more game with 0-2 (29 vs. 28)
2 fewer games with 3 (11 vs. 13)
3 more games with 4 (15 vs. 12)
6 fewer games with 5-6 (12 vs. 18)
6 more games with 7 (13 vs. 7)
2 fewer games with 8+ (16 vs. 18)
In short, it’s not the case that the Phillies’ average runs per game stat is inflated by big games, at least no more so than it is for other teams.
Summary
In summary, from game to game the Phillies offense is inconsistent only in the sense that all MLB teams are inconsistent — i.e. “that’s baseball”. In fact by the first couple of measures we looked at, if anything the Phillies have been at least as consistent as other teams, if not more so, even when comparing them to other likely playoff teams.
In addition, their distribution of runs scored is similar to the average likely playoff team, without an unusually high number of low-scoring or high-scoring games.
However when looking at changes in scoring from one week to the next, they are more prone than most teams to swing between periods of high offense and when they struggle to score. This speaks to another fear, that they’ll go cold at the wrong time. And, one might say, especially against good pitching like in the postseason, though we did review here that while they do worse against playoff-quality pitching, it’s to about the same extent as other postseason contenders.
The concern about the Phillies going cold is a legitimate one, but we should also keep in mind that teams like the Dodgers, Cubs, and Astros were only slightly more consistent in the week-to-week analysis.